
Arigin
Ikke hentetTurn data into clear, shareable figures
Av 海平 陈 · ProduktivitetHvorfor vi forventer det: The description clearly explains a focused scientific graphing workspace with concrete features and well-organized sections for Mac users.

Kort fortalt
Arigin is a productivity app for Mac users who need scientific graphing and analysis. It combines worksheets, around 20 plot types, curve fitting with residual reports, and figure export to PDF, PNG and other formats. Core analysis runs offline without an account, and the app does not automatically upload worksheets.
Sammendrag fra Debuts, basert på oppføringen i App Store.Om appen
Turn data into clear, shareable figures.
We built Arigin to give people using Apple computers a familiar, practical scientific graphing and analysis experience. Worksheets, plots, curve fitting, and reports come together in a focused workspace, so you can spend more time understanding your data.
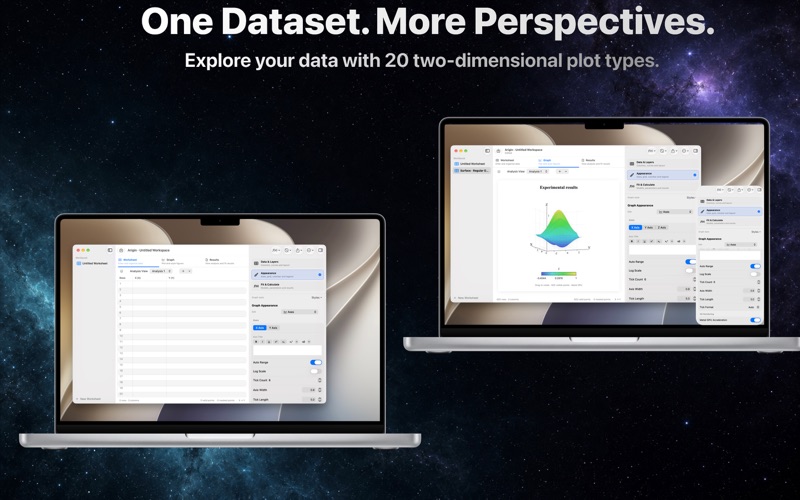
ONE DATASET, MULTIPLE PERSPECTIVES Create separate analysis views for the same worksheet, each with its own graph settings and results. Explore trends and distributions without repeatedly copying the source data.
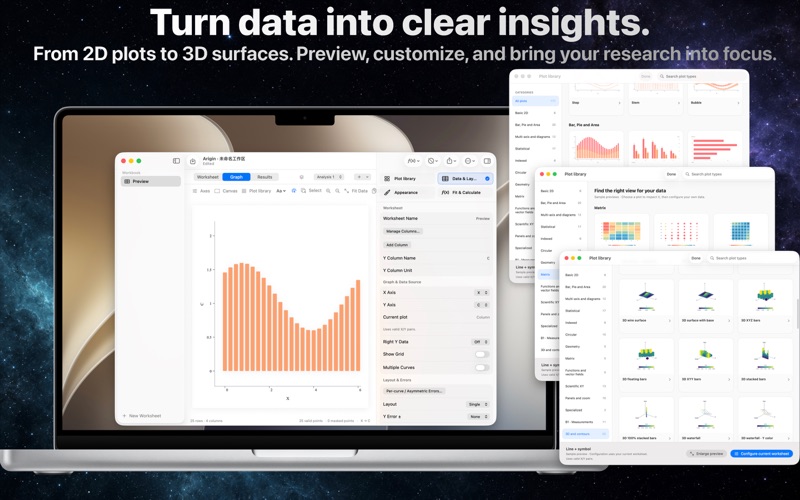
20 TWO-DIMENSIONAL PLOT TYPES Choose from lines, scatter, columns, bubbles, histograms, box plots, violins, empirical CDFs, Q–Q plots, polar plots, pies, donuts, and more. Explore spatial data with additional 3D scatter, surface, and contour views.
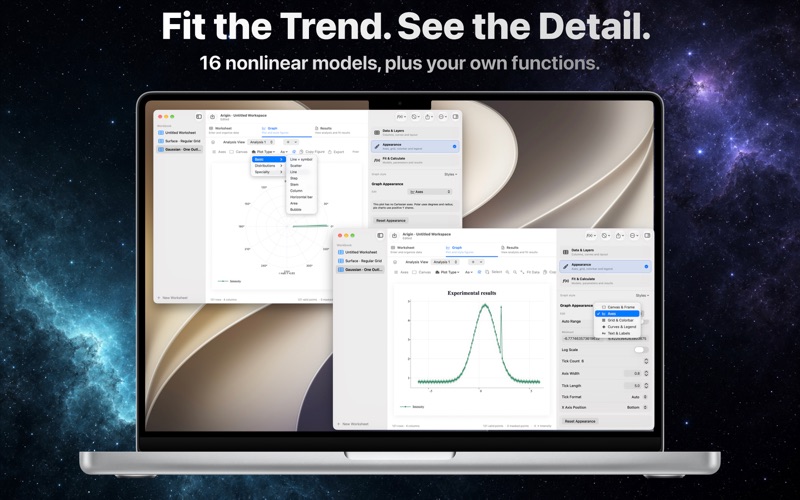
FIT TRENDS AND INSPECT RESIDUALS Use 16 built-in nonlinear models, first- through third-degree polynomials, or your own numerical function. Set initial values, fixed parameters, and bounds. Run single-curve or batch fits and inspect reports and residuals. Statistics, integration, differentiation, smoothing, interpolation, peak finding, and FFT bring common analysis tasks together.
REFINE THE DETAILS Supported basic plots offer multiple curves, dual Y axes, error bars, and multiple panels. Adjust axis positions, curve styles, grids, legends, and text. Use bold, italic, superscript, subscript, and common Greek characters for scientific titles.
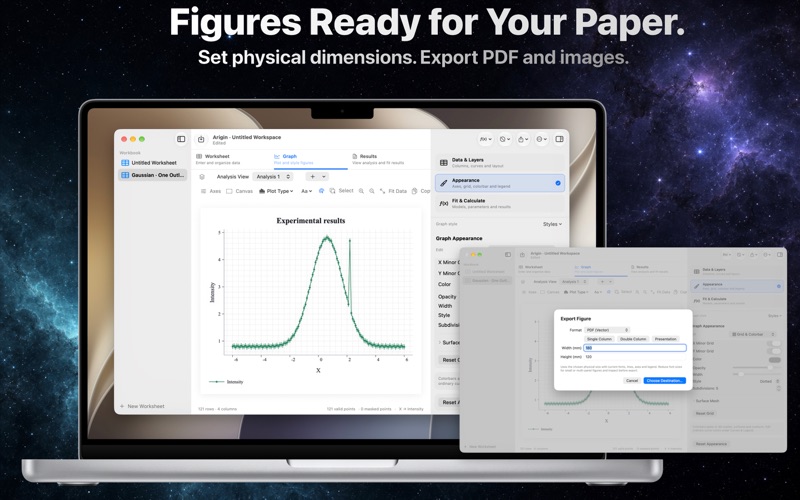
SIZE FIGURES FOR YOUR WORK Set canvas dimensions in centimeters, refine frames and fonts, and export PDF, PNG, BMP, TIFF, or JPEG. Copy figures to the clipboard or save an editable workspace for later.
WORK WITH FAMILIAR DATA FILES Import CSV, TSV, XLSX, and supported MAT and OPJ / OPJU numeric data. OPJ / OPJU support is limited to recognized data structures, not complete restoration of external projects. MAT v7.3 and legacy XLS are not supported.
LOCAL PROCESSING, TWO LANGUAGES Core analysis works offline without an account. The app does not automatically upload worksheets or analysis content. Switch between English and Simplified Chinese while preserving existing data names and user titles.
Interaction and editing capabilities vary by plot type. New distribution and specialty plots use automatic coordinates and do not offer every navigation, fit-overlay, or multi-axis feature of the basic plots. See the User Guide for details.
Developer: Hu Dongsheng Support: hudongsheng356@gmail.com
Slik vurderer folk den
Logg inn for å vurdere denne appen. Det ærlige svaret teller.
Ingen vurderinger ennå. Har du prøvd den? Vær den første til å vurdere.
Flere Produktivitet-apper
Ukens beste nye Produktivitet-apper ChickMark: Habit TrackerChickMark is a simple habit tracker for routines, goals, and reminders
 Dayflint: One Thing a DayToo many priorities?
 Fristo CAFMFristo is the app for Fristo CAFM, the facility management software
- BeginAnywayMorning alarm for hard tasks: set one task, prove you started, build a streak
 DHUDEDHUDE Analityxs es la herramienta de gestión diaria para grupos de restauración y ocio…
 Fillerless: Teleprompter CoachFillerless is a teleprompter that follows your voice and then tells you how you spoke